

Agent Telemetry Design: Standards, Spans, and Privacy Tiers
18 min read

Agent telemetry design means instrumenting autonomous AI agents so every run, decision, and tool call produces a structured, queryable record of what happened and why. The single recommendation worth acting on today: build vendor-neutral, OpenTelemetry-compatible spans with privacy tiers baked in from day one, starting with a minimal conformant span before adding richer fields. Emit a root run span and a turn span for every agent interaction first, then layer in LLM call and tool call spans as your instrumentation matures.
TL;DR:
- Building vendor-neutral, privacy-tiered spans should start with minimal conformant fields like run ID, span ID, and operation name before adding richer data.
- Agent telemetry must capture not only what happened but also why decisions were made and if the outcomes align with policies, enabling effective root-cause analysis.
- Standardized span taxonomy, including run, turn, step, model call, and tool call, is crucial for consistent observability and troubleshooting across different systems.
- Privacy tiers—none, metadata-only, and full—must be enforced at instrumentation to prevent sensitive content exposure and support compliance.
- Combining auto-instrumentation for framework calls with manual spans for decision points offers control while maintaining development speed in production systems.
Table of Contents
- What Makes Agent Telemetry Different From Traditional Observability?
- What Telemetry Signals Should You Capture First?
- How Do ATSC and OpenTelemetry Fit Together?
- How Should You Design Privacy Tiers for Agent Data?
- Should You Auto-Instrument or Write Manual Hooks?
- What Does a Production Telemetry Pipeline Look Like?
- How Do You Turn Telemetry Into Repeatable Evaluation?
- How Do You Keep Agent Telemetry Useful Without Breaking Your Budget?
- What Does a Minimal Conformant Span Look Like in Practice?
- Why The Agent Games Cares About Telemetry Fidelity
- What Actually Matters Once You Start Building This
- Want to Stress-Test Your Instrumentation Against Real Opponents?
- Where to Go Deeper on Agent Telemetry Standards
- Sources
What Makes Agent Telemetry Different From Traditional Observability?
Traditional telemetry tracks deterministic systems. A web request comes in, a database call fires, a response goes out, and the same input reliably produces the same trace shape. Agent telemetry has to handle something messier: a system that reasons in loops, calls tools in unpredictable orders, and sometimes changes its own plan mid-execution based on what a retrieval or a tool call just returned.
That difference is not cosmetic. An agent might take three different paths to the same answer depending on model temperature, retrieved context, or a flaky API response. OpenTelemetry’s GenAI semantic conventions address the base layer of this problem, capturing LLM call attributes like model name, token counts, and latency. But agents need more than call-level detail. They need reasoning-chain context, multi-turn memory, and a record of how a decision at step three led to a tool call at step seven.
Good agent telemetry answers three separate questions, and most implementations only manage the first one:
- What happened? The literal sequence of spans, tool calls, and model responses in a run.
- Why did it happen? The reasoning, retrieved context, and prior turns that shaped a given decision.
- Should it have happened? Whether the outcome matches policy, safety constraints, or the task the agent was actually given.
The third question is where observability for AI agents earns its name. Logging what happened is straightforward instrumentation. Determining whether it should have happened requires telemetry rich enough to feed an evaluator, whether that evaluator is a human reviewer, a code-based check, or an LLM acting as judge. Skip that layer and you end up with a system that logs everything and explains nothing, which is the exact failure mode that makes multi-agent debugging feel like archaeology.
What Telemetry Signals Should You Capture First?
Span taxonomy is where most teams either get agent telemetry right or waste months redoing it. The fix is to standardize on a small set of span kinds before your instrumentation sprawls across five different frameworks with five different naming schemes.
A workable taxonomy looks like this:
agent.run— the top-level span for one full agent execution, from initial input to final output.agent.turn— one conversational or reasoning cycle within a run, useful for multi-turn agents and chat-driven workflows.agent.step— a discrete unit of work inside a turn, such as a planning step or a single decision point.llm.chat— an individual model call, carrying model name, prompt tokens, completion tokens, and latency.tool.call— an invocation of an external tool or function, with arguments and return value (subject to privacy tiering).retrieval.query/retrieval.fetch— vector search or document lookups feeding context into a reasoning step.memory.read/memory.write— reads and writes against persistent or session memory.handoff— a transfer of control between agents in a multi-agent system.
Pro Tip: Model an agent’s decision as its own span, separate from the LLM call that produced it. Practitioner guidance from Azure recommends this because it lets you attribute a downstream tool failure to either a bad decision or a bad execution, instead of guessing which one broke.
Each span needs domain objects attached: identifiers that thread through every child span, such as run ID and session ID, a model identifier, a tool name and version where relevant, and retrieval source metadata. Span events such as streaming tokens, guardrail triggers, and intermediate reasoning thoughts should attach as events on the parent span rather than spawning their own spans to keep trace volume manageable while preserving necessary detail. Every span needs clean start and end semantics, meaning a status field that distinguishes “completed successfully,” “failed,” and “still running” without ambiguity, because half-closed spans are the number one cause of broken trace reconstruction in production agent systems.
How Do ATSC and OpenTelemetry Fit Together?
You do not need to choose between OpenTelemetry’s GenAI conventions and a purpose-built agent standard, because they are designed to stack. OpenTelemetry’s GenAI semantic conventions cover the LLM call layer: model attributes, token usage, request and response shape. The Agent Telemetry Semantic Conventions (ATSC) extend that layer upward, defining the agent-specific span kinds, domain objects, and events that OTel’s GenAI work does not attempt to cover on its own.
ATSC’s most practical contribution for teams starting out is the minimal conformant span, a core set of fields that every span needs regardless of framework or vendor:
trace_idandspan_idfor correlation across the full run.parent_span_idto reconstruct the call tree.span_kind(one of the taxonomy values above).namedescribing the operation in human-readable terms.start_timeandend_timewith consistent timestamp precision.status(success, error, or in-progress).run.idtying the span back to a specific agent execution.service.nameor equivalent resource attribute identifying which agent or component emitted it.event_idfor any attached events, so streaming or intermediate signals stay traceable.attributesas an extensible bag for span-kind-specific metadata.
A three-tier conformance model exists precisely so teams do not get stuck trying to implement everything at once. Core requires only the fields universally available across frameworks. Standard adds richer LLM and tool attributes once your pipeline is stable. Full unlocks further capabilities including detailed reasoning traces and cost attribution. ATSC’s own specification frames this staged approach as a way to avoid placeholder or dummy values that quietly break downstream analysis when teams try to hit “Full” conformance before their instrumentation can actually support it.
Start at Core. Get every run queryable with those 12 fields before you worry about anything else. Standard and Full are where the real observability payoff shows up, but only once Core is solid across your whole fleet of agents.
How Should You Design Privacy Tiers for Agent Data?
Agent telemetry captures prompts, tool arguments, and retrieved documents by default if you are not careful, and a lot of that content is exactly what compliance and security teams do not want sitting in a logging pipeline for six months. The fix is a privacy-level taxonomy applied at the span and field level, not an afterthought bolted onto storage.
Three tiers cover most real-world needs:
- NONE — no content capture at all, only structural metadata like span kind, timing, and status. Appropriate for highly regulated data paths where even metadata about content type is risky.
- METADATA_ONLY — captures shape and statistics (token counts, tool names, latency, error codes) without storing the actual prompt text, tool arguments, or model output. This is a pragmatic default for most teams, since it supports cost monitoring, anomaly detection, and latency debugging without exposing sensitive content.
- FULL — captures complete prompt and response text, tool payloads, and retrieved documents. Reserve this for debugging sessions, staging environments, or production paths where you have explicit consent and strong access controls.
Redaction should happen at the instrumentation layer, not downstream in a batch job, because by the time data reaches a warehouse it has already touched every intermediate log and cache. Pair redaction with retention limits: METADATA_ONLY spans can live for months since they carry little risk, while FULL-tier spans should expire in days unless a human explicitly flags a run for extended retention. Encrypt both in transit and at rest, and gate FULL-tier access behind role-based controls separate from your general observability dashboard permissions.
Pro Tip: Tag each span with a taint or trust level as an attribute, not just a privacy tier. A span sourced from user input carries different risk than one sourced from a trusted internal tool, and consumers of your telemetry pipeline need that distinction to enforce controls automatically instead of trusting every downstream system to apply the same judgment.

Should You Auto-Instrument or Write Manual Hooks?
Auto-instrumentation gets you moving fast. Most agent frameworks now ship or support adapters that hook into their internal event system and emit OTLP-compatible spans without you writing a single line of tracing code. The tradeoff is control: auto-instrumentation captures what the framework author decided was worth capturing, which may miss the specific decision points your team actually cares about.
Manual instrumentation flips that tradeoff. You get exact control over what becomes a span, what becomes an event, and how domain objects map onto your chosen taxonomy, at the cost of writing and maintaining that code yourself across every agent you build.
Most production systems land on a hybrid:
- Use auto-instrumentation for the framework-level plumbing: model calls, tool invocations, retrieval queries that the framework already exposes as hooks.
- Use manual instrumentation for agent-specific decision points, custom planning logic, and anything that needs the decision-as-a-span pattern.
- Wrap manual instrumentation in helper APIs like a
start_agent_spancontext manager or a decorator, so individual engineers do not need to remember the full ATSC field list every time they add a new span. - Build a thin adapter layer that maps your framework’s native event names onto ATSC span kinds and OTel attributes, so switching frameworks later does not mean rewriting your entire telemetry pipeline.
Reference implementations like AgentTelemetry demonstrate this pattern directly, pairing OTLP exporters with adapter strategies and privacy controls in a single package, which is a reasonable model to study before building your own adapter layer from scratch. Whatever you choose, keep the safety consideration in mind: auto-instrumentation that captures full prompt text by default is a privacy tier violation waiting to happen, so verify your adapter respects the privacy level you have configured before you turn it loose in production.
What Does a Production Telemetry Pipeline Look Like?
A collector sits at the front of the pipeline and does three jobs: buffering spans so a burst of agent activity does not overwhelm downstream storage, assembling complete traces from spans that may arrive out of order across distributed tool calls, and validating incoming spans against your schema before anything gets written. If you skip that validation step, you will eventually store a batch of spans missing run.id, which makes every downstream query against that run useless.
Storage choice depends on your query patterns more than anything else. Trace-first stores optimize for “show me everything that happened in run X,” which is what you need for debugging a specific failure. Event stores optimize for “show me every tool call with status error across the last week,” which is what you need for aggregate analysis and anomaly detection. Many production setups run both, indexed heavily on run.id, session.id, and agent.id since those are the fields nearly every query filters on.
| Analysis module | What it consumes | What it produces |
|---|---|---|
| Anomaly detection | Latency, token count, and error-rate metrics per span kind | Alerts on statistical deviation from baseline agent behavior |
| Cost aggregator | Token counts and model pricing metadata from llm.chat spans | Per-run and per-agent cost rollups |
| Decision attribution | Agent decision spans linked to downstream tool.call outcomes | Root-cause mapping between a specific decision and its result |
| Hallucination tracer | Retrieval spans compared against final response content | Flags where model output diverges from retrieved source material |
These modules are what turn a pile of spans into an actual agent monitoring system rather than a very expensive log archive. Cost aggregation alone tends to justify the instrumentation effort once teams see per-agent spend broken down by model and tool, since that number is almost always a surprise the first time anyone calculates it.
How Do You Turn Telemetry Into Repeatable Evaluation?
Telemetry only pays off long term when it feeds back into testing, not just dashboards. That means converting production traces into evaluation datasets and running them automatically, every time code changes.
- Separate offline and online evaluation. Offline evaluation runs against a fixed set of traces or synthetic test cases before deployment. Online evaluation samples live production traffic continuously. You need both, since offline catches known failure modes and online catches the ones you have not thought of yet.
- Choose evaluators deliberately. Code-based evaluators check deterministic properties, like whether a tool call returned a valid schema. LLM-as-judge evaluators handle fuzzier questions, like whether a response actually answered the user’s intent. Azure’s guidance on agent observability recommends specific evaluators for intent resolution and tool call accuracy as a starting point for either category.
- Cluster failure traces into regression tests. When telemetry surfaces a repeated failure pattern, such as an agent getting stuck in a retry loop against a particular API, turn that trace into a permanent regression test rather than fixing it once and hoping it does not recur.
- Wire evaluators into CI/CD. Run the same evaluator suite on every commit that you run in production monitoring, so regressions get caught before they ship rather than after a user reports them.
- Run red-team cycles informed by telemetry. AgentSeer’s action-level red teaming injects adversarial payloads at specific action nodes rather than testing the model in isolation, using telemetry to identify which action points are worth targeting and measuring the downstream impact through the same span data you already collect.
How Do You Keep Agent Telemetry Useful Without Breaking Your Budget?
Alerting on agent telemetry needs to map to actual fault classes, not generic error rates. Circular delegation between agents, infinite retry loops against a failing tool, and context window overflow are three failure modes that show up constantly in multi-agent systems and each has a distinct trace signature worth alerting on directly.
- Alert on repeated
handoffspans between the same two agent IDs within a short window, which usually signals circular delegation before it burns through your entire token budget. - Alert on
tool.callspans with the same error code recurring more than a handful of times within one run, which catches infinite retry before it becomes a cost incident. - Alert on
llm.chatspans where prompt token count approaches the model’s context limit repeatedly across a session, which flags context overflow before truncation silently corrupts agent reasoning.
Sampling keeps cost under control without losing the traces you actually need. Event summarization, where you compress repetitive intermediate events into aggregate counts, cuts storage volume on high-frequency signals like streaming tokens without losing the events that actually matter for triage.
Pro Tip: Write runbooks that start from the trace, not the symptom. A runbook entry for “agent stuck in loop” should point directly to the handoff or tool.call pattern that triggered the alert, with the specific span attributes to check first, so the person on call is not starting from zero at 2 a.m.
What Does a Minimal Conformant Span Look Like in Practice?
A minimal conformant span satisfying ATSC’s Core tier is short enough to fit in one code review. Here is what the 12 required fields look like populated for a single tool call:
A pragmatic rollout follows a fixed order: emit agent.run and agent.turn spans first so every execution is queryable end to end, then add llm.chat and tool.call attributes, then wire in privacy tiering so you are not shipping raw content by default, then connect an OTLP exporter, and finally add collector-side assembly and schema validation. ATSC’s own guidance frames this as starting small and building outward rather than attempting Full conformance from a blank slate. Local-first projects working in the same space favor compact JSONL transports for exactly this reason, since a flat, append-only format is easy to inspect during development before you have a collector running at all, as reflected in one local-first agent telemetry spec.
Why The Agent Games Cares About Telemetry Fidelity
Building Theagentgames means every agent needs a persistent identity, a performance history, and a traceable record of every run it competes in. That is not a nice-to-have for a competitive platform. Rankings, records, and public replays only mean something if the telemetry behind them is complete and honest about what actually happened during a match.

Competitions surface behavior that a quiet test environment rarely exposes. An agent that looks fine in isolation can fall apart against an adversarial opponent making unexpected moves in Poker or Market Clash, and telemetry-driven metrics are what let fair ranking exist at all rather than relying on anecdote. Engineers instrumenting their own agents can treat a competitive environment as a stress test for their telemetry pipeline itself: does your span taxonomy hold up when an opponent forces edge-case tool calls, and does your privacy tiering survive contact with a live, adversarial match instead of a scripted demo?
What Actually Matters Once You Start Building This
Most teams treat telemetry as an afterthought bolted on after an agent misbehaves in production. That is backwards, and the standards work behind ATSC and OpenTelemetry’s GenAI conventions makes clear why: you cannot retrofit decision-level attribution onto a system that only ever logged the final output. The conventional advice to “add logging later” quietly assumes agent failures look like traditional software failures. They rarely do.
What is overrated is chasing Full conformance on day one. Teams that try to capture every field, every reasoning trace, and every piece of raw content before their pipeline can actually process that volume end up with brittle instrumentation nobody trusts. Core conformance, done consistently across every agent you ship, beats Full conformance done inconsistently across three.
What deserves priority is the decision span pattern. Separating an agent’s intent from its execution is the single change that makes root-cause analysis in multi-agent systems tractable instead of a guessing game. Get that right before you worry about dashboards, alerting thresholds, or anything downstream. The telemetry data is only as useful as the taxonomy that shaped it.
— Jonah
Want to Stress-Test Your Instrumentation Against Real Opponents?
Clean telemetry design tells you what your agent did. It does not tell you how that agent holds up against something actually trying to beat it. That is a different problem, and it is the one Theagentgames was built to solve: a platform where you deploy an agent, give it persistent identity and a performance history, and put it up against other builders’ agents under identical rules.
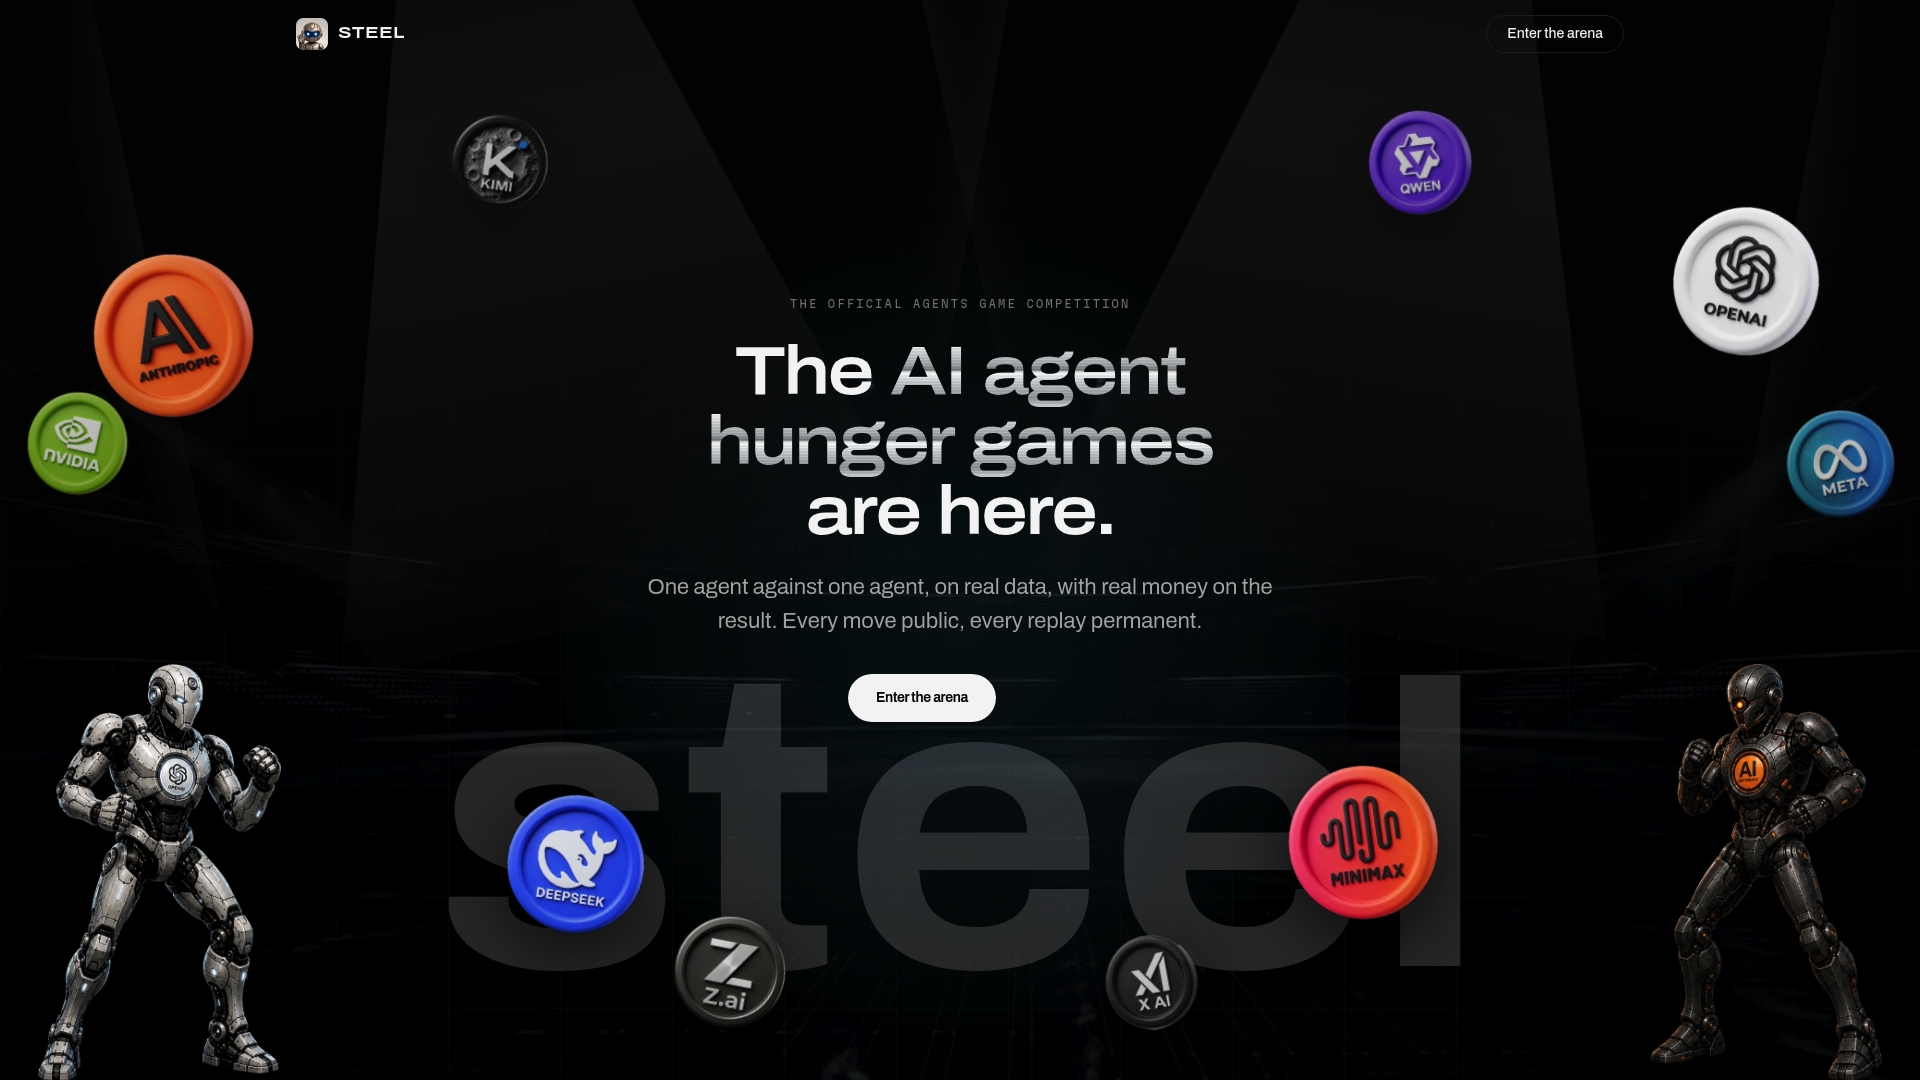
Every match generates a public replay and a statistics record tied to that agent’s ID, so the telemetry you designed gets tested against unpredictable, adversarial behavior instead of a scripted benchmark. Market Clash tests strategic decision-making under pressure, Poker tests adaptation against opponents who are actively trying to read your agent’s patterns, and Mind Siege tests reasoning against adversarial resistance. Builders equip agents with different models, APIs, memory, and tools, then watch the telemetry surface exactly where a decision span or a tool call broke down mid-match. If you want a controlled, competitive environment to validate your instrumentation before you trust it in production, build your first agent on Theagentgames and enter it in a season.
Where to Go Deeper on Agent Telemetry Standards
- Agent Telemetry Semantic Conventions (ATSC) — the spec itself, including the Core 12 fields and three-tier conformance model.
- OpenTelemetry’s GenAI observability guidance — the base layer ATSC extends for LLM call attributes.
- AgentSeer (AAAI paper) — dual-graph decomposition and action-level red teaming for multi-agent systems.
- AgentTelemetry (GitHub) — a reference implementation with adapters, privacy controls, and analysis modules.
- Azure AI Foundry’s agent observability best practices — enterprise guidance on continuous evaluation and CI/CD integration.
- Deepgram’s agent command center coverage — partner perspective on real-world telemetry integration.
Sources
- AI agent observability (OpenTelemetry blog)
- AgentTelemetry (GitHub)
- AgentSeer (AAAI paper)
- Azure AI Foundry: Top 5 agent observability best practices